- Installation
- User Interface
- Predefined Projects
- Build Configurations
- Project Natures
- Non-top files
- default.build
- Auto-config
- Simulator Log-config
- Emulating compiler invocations
- Multiple .build Files
- Compatibility Modes
- Paths
- Strings
- Comments
- Environment Variables
- Including Other Argument Files
- Build Persistence
- All Build Directives
- SystemVerilog OVM or UVM Library Compilation
- Xilinx Libraries Compilation
- Intel(Altera) Quartus Libraries Compilation
- Questa Libraries Compilation
- Use of External Programs
- Compile Checks
- Quick Fix Proposals
- Content Assist (Autocomplete)
- Hyperlinks
- Show Usages
- Show Readers or Writers
- Show Call Hierarchy
- Show Type Hierarchy
- Show Constraints
- Show Instances
- Peek Exploration
- Refactoring
- Override Functions
- Generate Setters and Getters
- Code Factory
- Code Formatting
- Breadcrumb Navigation Bar
- Diagrams
- Syntax Coloring
- Tooltips
- Workspace Symbols
- Views
- Quick Search in Views
- Content Filters
- Macros Support
- Inactive Generates Code Highlight
- Database Out of Sync Notification
- External Tools Integration
- UVM Support
- Scripts
- Custom Scripts
- SCM Checkout Hook
- Memory Monitor
- Application Notes
- Handy VS Code Documentation Pointers
- What is New?
- > How to Report an Issue?
- Legal Notices
- Third Party Licenses
- Q & A
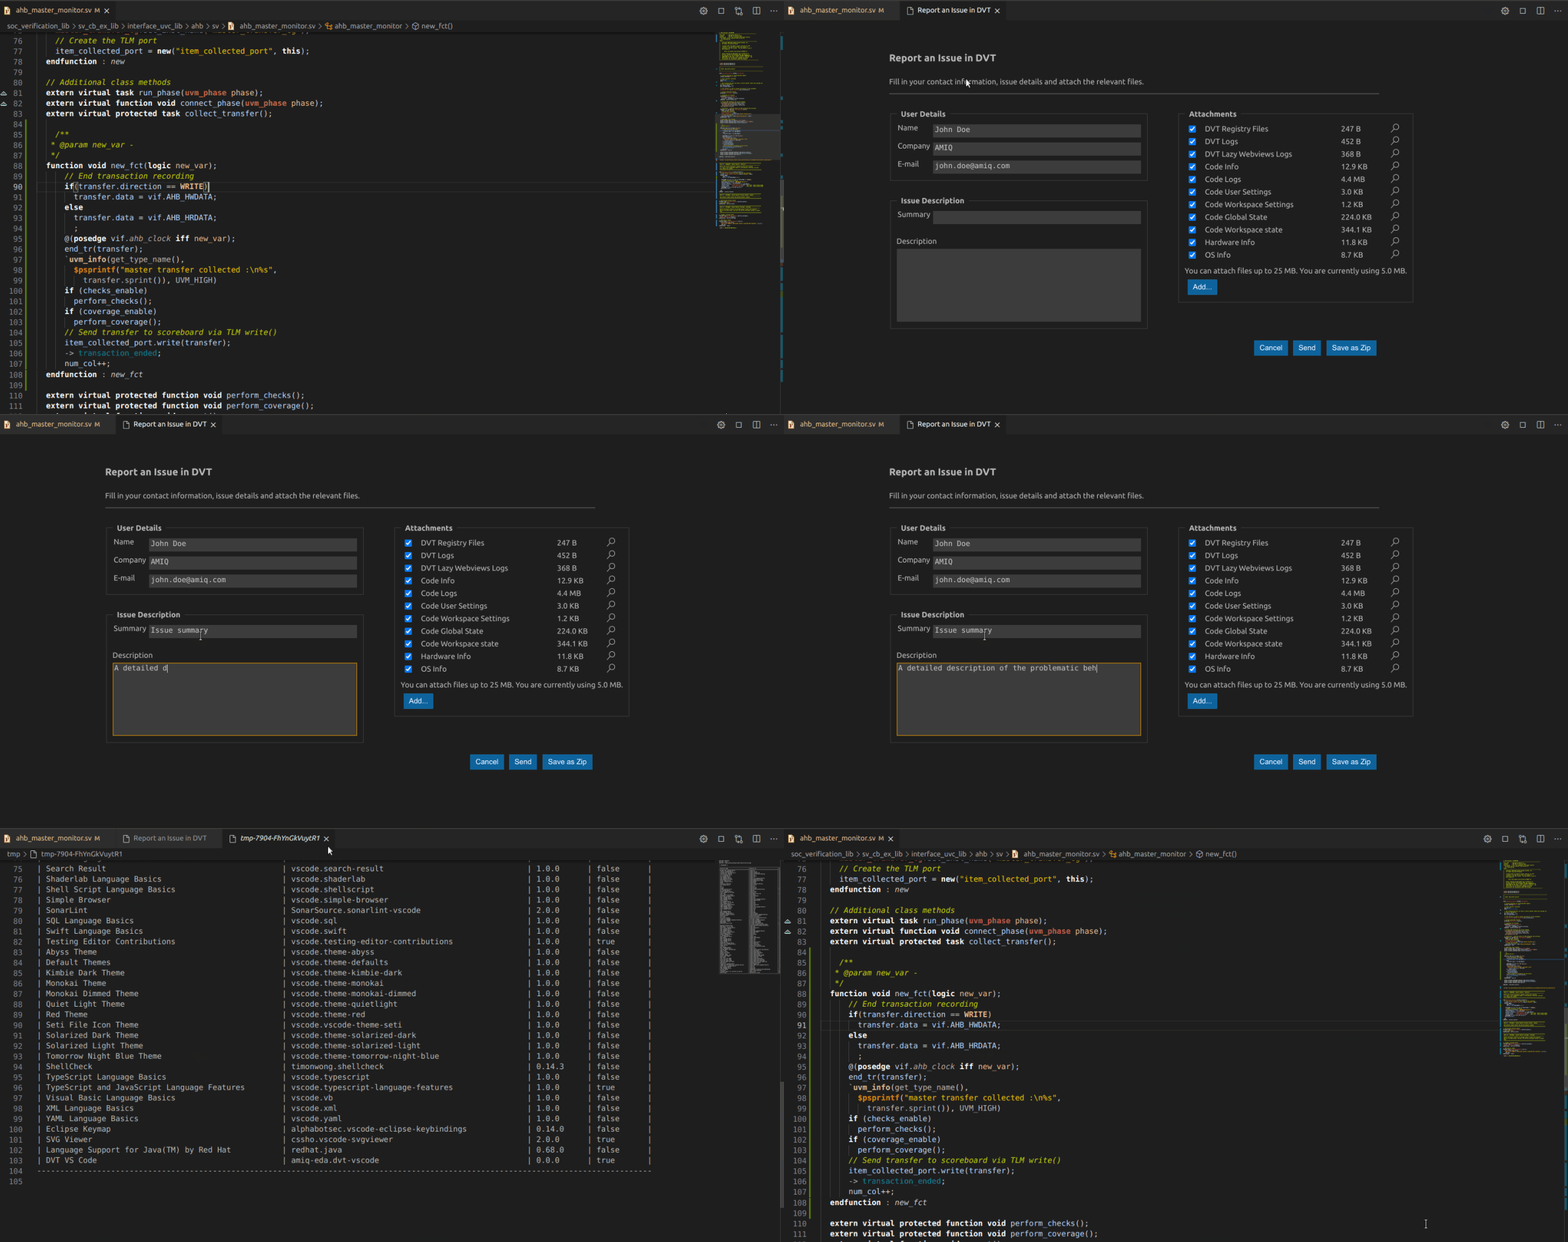
You can send an issue report using the "DVT: Report an Issue command. Along with a problem description, we often need logs and system information in order to reproduce a problematic behavior and fix it.
Fill in the identification data (will be remembered for future reports) and issue description. Attach screenshots, code snippets or any other files you consider helpful in reproducing the problem. By default various application logs and diagnostic files are attached. You can preview any attachment using the magnifier icon.
When you click 'Send', an e-mail is sent to support@amiq.com with your own address in CC. You can also save the issue report as a zip archive, and send it manually to support@amiq.com (for example if you don't have Internet connectivity on the machine where DVT runs).
The most useful debug information when dealing with performance issues is a JVM thread dump. Most likely this will help us pinpoint the problem and provide a fast solution.

How to generate a thread dump from within DVT for VS Code?
To generate a thread dump from within DVT for VS Code use the "DVT: Start Thread Dump Collector" command. Perform the operation that causes the performance issue and afterwards stop the process using the "DVT: Stop Thread Dump Collector" command.
The thread dump is generated at $HOME/.dvt/ls/logs.
Note: The "DVT: Start Thread Dump Collector" / "DVT: Stop Thread Dump Collector" commands can be invoked also by using the buttons from the Diagnostics View toolbar.