- Installation
- User Interface
- Predefined Projects
- Build Configurations
- Project Natures
- Non-top files
- default.build
- Auto-config
- Simulator Log-config
- Emulating compiler invocations
- Multiple .build Files
- Compatibility Modes
- Paths
- Strings
- Comments
- Environment Variables
- Including Other Argument Files
- Build Persistence
- All Build Directives
- SystemVerilog OVM or UVM Library Compilation
- Xilinx Libraries Compilation
- Intel(Altera) Quartus Libraries Compilation
- Questa Libraries Compilation
- Use of External Programs
- Compile Checks
- Quick Fix Proposals
- Content Assist (Autocomplete)
- Hyperlinks
- Show Usages
- Show Readers or Writers
- Show Instances
- Peek Exploration
- Refactoring
- Code Factory
- Code Formatting
- Breadcrumb Navigation Bar
- Diagrams
- Syntax Coloring
- Inactive Generates Code Highlight
- Database Out of Sync Notification
- Tooltips
- Workspace Symbols
- Views
- Quick Search in Views
- Content Filters
- External Tools Integration
- Scripts
- Custom Scripts
- SCM Checkout Hook
- > Memory Monitor
- Application Notes
- Handy VS Code Documentation Pointers
- What is New?
- How to Report an Issue?
- Legal Notices
- Third Party Licenses
- Q & A
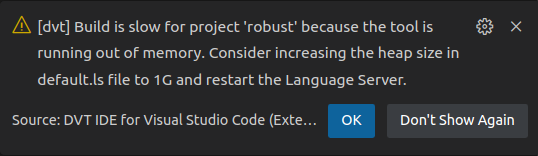
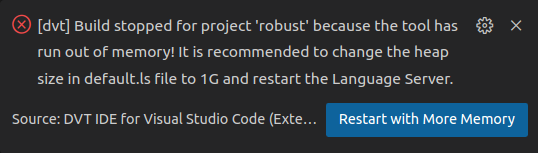
The Memory Monitor keeps track of the memory usage during memory intensive operations such as Build and Linting (Verissimo) and notifies you when:
The operation in progress is significantly slowed down by low memory:

A memory starvation state is reached

Note: Memory starvation happens when the active Language Server (the one that the VS Code client is connected to) struggles to cope with insufficient memory and ultimately leads to major performance degradation. This can easily be fixed by allocating enough memory to fit the project's size.
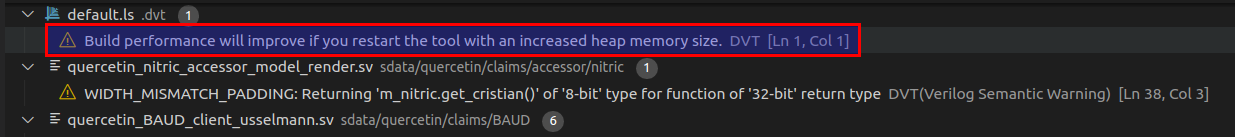
Such messages will be printed to console - see Output and logging. In the DVT IDE for Visual Studio Code you will also get feedback via:
a pop-up notification
a problem in the Problems View

an item in Status Bar


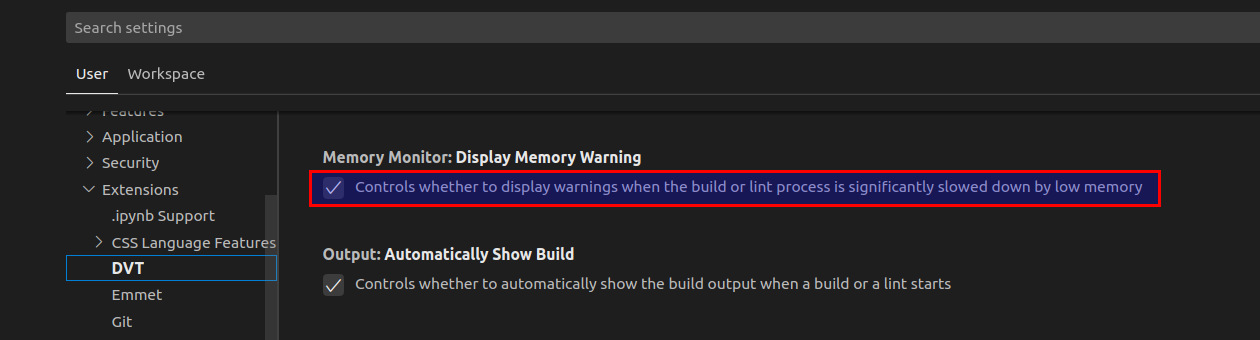
You can disable the warning notifications by:
choosing the "Don't show again" option from the pop-up notification
disabling the "Display Memory Warning" preference from File > Preferences > Settings > Extensions > DVT > Memory Monitor.
To disable the Memory Monitor, add the +dvt_disable_memory_starvation_handling directive in the build configuration file.
To generate Memory Monitor debug information, add the +dvt_enable_memory_starvation_handling_debug directive in the build configuration file. Afterwards, the next monitoring session will generate a log file dvt_memory_monitor_<timestamp>.log in the project's root.
Note: For advanced debugging, you can control Memory Monitor parameters using the following directive:
+dvt_set_memory_starvation_handling_parameters+start_delay=<time_in_ms>+warning_th=<used_mem_percent>+gc_time=<gc_percent_time>+time_window=<build_time_percent>