- Installation Checklist
- Predefined Projects
- Getting Started
- What is a Workspace
- What is a Project
- Project Natures
- Workspace and Workbench
- Refresh
- Linked Resources
- Backup and Local History
- Basic Tutorial
- Switch to the DVT Perspective
- Open a Project
- Configure the Build
- Build the Project
- Inspect the Compilation Errors
- See Comments in Tooltips
- Use Hyperlinks to Move Around in the Code
- Quickly Open a Type (Class, Module, Interface)
- Quickly Inspect the Class Hierarchy
- Quickly Open a File
- Quickly Move Inside the Editor
- Inspect the Class Hierarchy and Class Members
- Inspect the Design Hierarchy
- Inspect the Verification Hierarchy
- Browse Through All the Available Types (Classes, Modules, Interfaces)
- Look for the Implementation of an Extern Function or Task
- Search for Entities
- Use Content Assist (Autocomplete)
- Use Code Templates
- Use Module Auto Instance
- Expand Macros (Apply Preprocessing)
- Trace Macro Errors
- Track Tasks using TODO Markers
- Quickly See the Current Scope in the Status Bar
- Fold Code Regions in Order to Improve Readability
- Access the Context Sensitive Help
- Build Configurations
- Non-top files
- default.build
- Auto-config
- Simulator Log-config
- Emulating compiler invocations
- Multiple .build Files
- Compatibility Modes
- Paths
- Strings
- Comments
- Environment Variables
- Including Other Argument Files
- Build Persistence
- DVT Auto-Linked
- Run a Script Before Build
- All Build Directives
- e Language Test Files
- e Language SPECMAN_PATH
- SystemVerilog OVM or UVM Library Compilation
- Xilinx Libraries Compilation
- Intel(Altera) Quartus Libraries Compilation
- Questa Libraries Compilation
- Use of External Programs
- Compile Checks
- Content Assist (Autocomplete)
- Quick Fix Proposals
- Add Parameter to Module
- Add Port to Module
- Add Signal to Sensitivity List
- Add Virtual Qualifier to Interface Type
- Correct Spelling In Comments and Strings
- Create Class In New File
- Create File From Build Config Editor
- Create Included File
- Create Interface Class In New File
- Declare Method
- Declare Variable
- Did You Mean
- Explicitly Declare
- Fully Qualify Type
- Implement Extern Method
- Implement Missing Pure Virtual Methods
- Import Type
- Remove 'local' or 'protected' Qualifier
- Remove Signal from Sensitivity List
- Remove Signal Never Used
- Update Extern Prototype/Implementation
- Update Module Instance
- Update Virtual Method Signature
- Waive Compilation Problems
- Quick Assist Proposals
- Bind Method Call Arguments by Name
- Bind Method Call Arguments by Position
- Connect Instance Ports by Name
- Connect Instance Ports by Position
- Expand .* Port Connections
- Extract to Variable
- Extract to Method
- Extract to Module
- Move Selection to New File
- Join Extern and Implementation
- Split to Extern and Implementation
- Rename in File
- Content Filters
- Code Templates
- File Templates
- Project Templates
- Code Formatting
- Override Functions
- Generate Getters and Setters
- Module Automatic Instantiation
- Semantic Search
- Show Usages, Readers or Writers
- Favorite Searches
- Show Constraints
- Show Instances
- Quick Search in Views
- Trace Connections
- Breadcrumb Navigation Bar
- Code Factory
- Refactoring
- Rename Refactoring
- Rename Port Across the Design Hierarchy
- Rename File
- Bind Method Call Arguments by Name
- Bind Method Call Arguments by Position
- Connect Instance Ports by Name
- Connect Instance Ports by Position
- Expand .* Port Connections
- Extract to Variable
- Extract to Method
- Extract to Module
- Move Selection to New File
- Join Extern and Implementation
- Split to Extern and Implementation
- Change Method Signature
- Connect Instances Across the Design Hierarchy
- Add Port to Module from Selected Field
- Add New Port to Module
- Add New Parameter to Module
- Refactoring Scripts
- Diagrams
- Low Power Format Support
- Export HTML/PDF Documentation
- External Tools Integration
- Debugger Integration
- Custom Dialogs
- Command Line Interface
- dvt_cli.sh
- Syntax
- Examples
- Makefile Example
- Commands
- Create a Project (Mixed-Language Capable)
- Create a Project From an Existing Template
- Import an Existing Project
- List Compiled Files
- Compare Files
- Launch a Run Configuration
- Open a File
- Close a File
- Open a Custom Dialog
- Open a Perspective
- Refresh a Project
- Rebuild a Project
- Print Edited File
- Quit
- Query the running status
- Print version
- Run Performance Exploration
- Macros Support
- Reminders (TODO Markers)
- OVM Support
- > UVM Support
- VMM Support
- Settings Management
- Reference
- Comments Formatting
- Common Shortcuts
- Custom Pragmas
- DVT Resource Monitor
- Editor Notification
- Editor Right Click Menu
- Hyperlinks
- Icons and Decorations
- Inactive Generates Code Highlight
- Lazy Bring up Resources
- Memory Monitor
- Scripts
- Syntax Coloring
- Themes
- Toolbar Actions
- Tooltips
- Views
- Call Hierarchy View
- Checks View
- Code Templates View
- Compile Order View
- Config DB View
- Console View
- Coverage View
- Design Hierarchy View
- Factory Overrides View
- Inspect View
- Layers View
- Macros View
- Outline View
- Problems View
- Registers View
- Tasks View
- Trace Connections View
- Types View
- Type Hierarchy View
- UVM Browser View
- UVM Sequence Tree View
- Verification Hierarchy View
- Application Notes
- C/C++ support
- Design Elaboration
- Compilation Speed-up
- Precompilation Support
- Encrypted VIP Support
- FPGA Support
- Generating External Tool Scripts from the DVT Build Configuration
- Incremental Compilation
- Preprocessed Files Support
- Output and logging
- UVM Library Compilation Troubleshooting
- Visual Artifacts
- Tips and Tricks
- Q & A
- I am new to Eclipse, where should I start from?
- Where can I find DVT Help?
- How do I see and configure the key shortcuts?
- Are there any backup files in Eclipse?
- Workspace in use, cannot launch eclipse...
- Locking is not possible in the directory...
- How to start DVT Eclipse with a different eclipse.ini
- Save could not be completed
- IBM Clearcase Plugin
- Non existing package mti_fli
- How to use Working Sets for filtering Problems/Task/Search views?
- How to handle Simulator and Command Line Macros
- How do I Access Files Outside Project Dir - Working with Linked Resources
- Mapping Linux to Windows (/proj/ to Z:\proj\)
- Subversive vs Subclipse
- How do I associate a project with both DVT and CDT?
- Can I use vi/vim along with DVT?
- Can I perform dos2unix or unix2dos from DVT?
- How can I configure Eclipse to use a local CVS repository?
- I am using the Common Desktop Environment via Citrix and experiencing crashes. What can I do?
- How do I change the background color of the Editor?
- Some widget colors are not displayed properly. What can I do?
- How do I change the tooltip colors?
- How do I change Internet Proxy Settings?
- Eclipse does not start, there is no Workspace, metadata or log file created
- Workspace permissions
- How do I link mylyn with Bugzilla?
- How do I print source code?
- How do I disable Eclipse Software Sites?
- How do I revert to a previous version?
- What are the most common shortcuts in DVT?
- How does DVT integrate with emacs?
- How does DVT integrate with CVS?
- How to set an environment variable within a Run Configuration?
- How to run a remote Unix commnad from DVT Eclipse for Windows?
- Rebuild shortcut (Ctrl + Alt + R) does not work
- I want to use an alias in a DVT Generic Run Configuration, but it's not recognized
- How to set multiple paths as sources of predefined projects ?
- Lines are suddenly changing indentation when I edit text or move the cursor through the editor.
- How to change the directory where the build log file is saved ?
- How to find the DVT logs on Linux/Unix ?
- How to create resource filters ?
- How to create custom shortcut and button for a Run Configuration?
- I know that file.foo is present in the project location, but I can't see it in the Navigator View
- How to copy the full path to the file in the current editor?
- How to adjust the console logs filters matching parameters?
- When I switch to Block (Column) Selection mode the font changes
- In Block (Column) Selection mode I see strange editng artifacts
- How to modify the font size in the code editors?
- How to automatically checkout/lock files from the revision control system ?
- How can I see if a file is read-only?
- How can I open a file in DVT from the terminal?
- How can I open a file in DVT from Questa?
- How do I change the name of the xterm opened by a DVT Generic Run Configuration?
- I get errors while installing or updating a plugin from an update site
- What is New?
- How to Report an Issue?
- Legal Notices
- Third Party Licenses
By performing the runtime elaboration of a UVM test, you can view testbench structures accurately reflecting the configuration at start of simulation.
Go to the UVM menu and Select Verification Top.

Pick a test and check Perform UVM runtime elaboration.
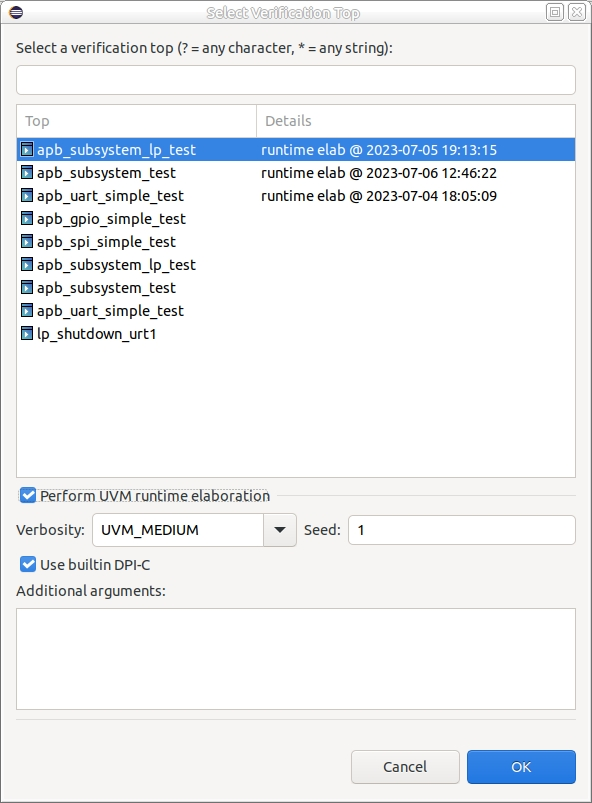
Alternatively, press the T button in the Verification Hierarchy view toolbar. Any runtime elaboration of a test is automatically saved and you can later select it as a Verification Top.
The output of the UVM elaboration is printed in the Console View.
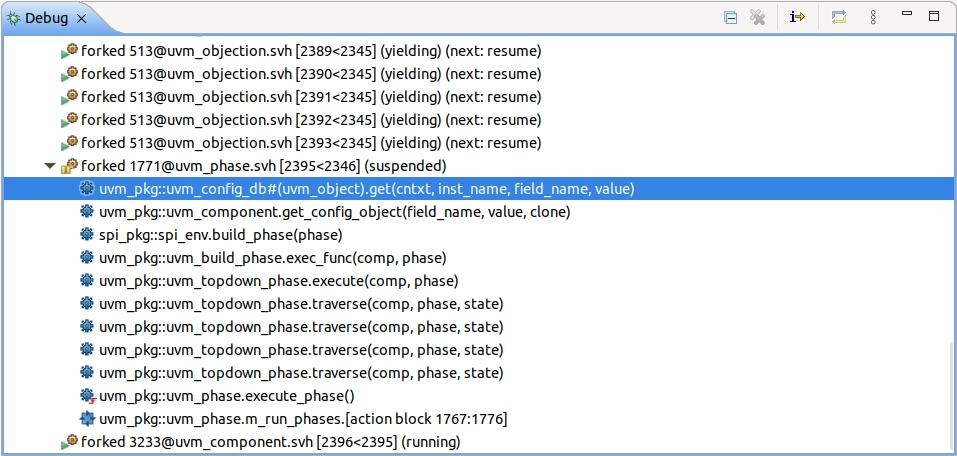
Double click on the left vertical bar to add / remove a breakpoint. If you set any breakpoint in the source code, you are prompted to switch to the Debug Perspective. Elaboration suspends whenever a breakpoint is reached.
The Debug View presents all the threads and the current call stack.
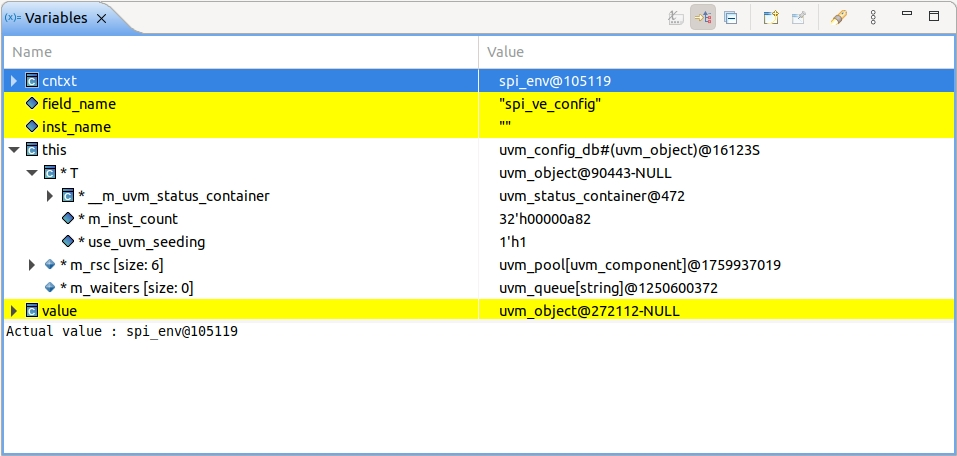
The Variables View presents variable values in the current scope.
The Breakpoints View presents all the breakpoints and their enablement state.
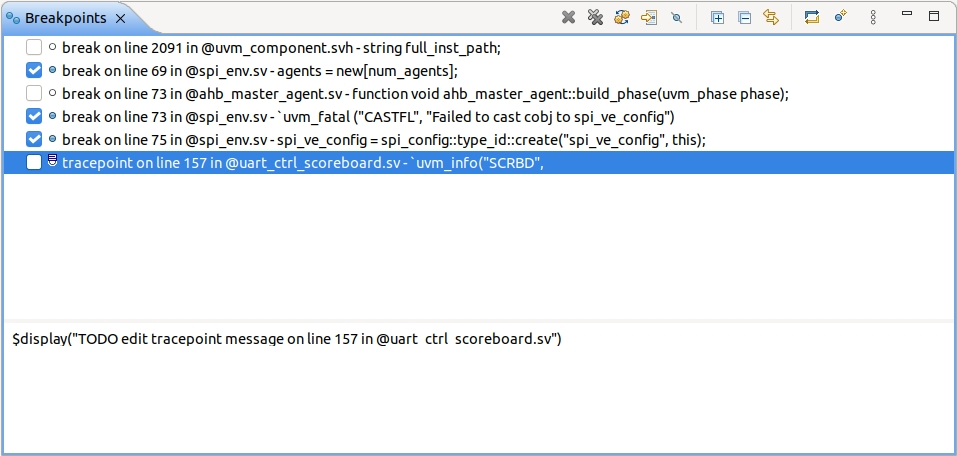
You can also add printouts without altering the source code by using tracepoints. Right click on the left vertical bar to add a tracepoint. You can use only a $display() statement in the editable textbox below the breakpoints list, however its arguments may call other functions.
DPI-C Handling
The UVM runtime elaboration involves DPI-C method calls. DVT has a built-in library of UVM DPI-C implementations. To use it simply check the corresponding box in the verification top selection dialog.
If user-defined DPI-C functions are involved in the elaboration, specify the required shared objects in the Additional arguments textarea using the standard - sv_lib, - sv_liblist and - sv_root flags, for example:
-sv_lib /path/to/dpic.so
From the Project menu you can Generate the DPI-C header stubs required for the C compilation. Headers, C++ sources and object files are created in the dvt_dpic directory located in the project root. Particularly if your project uses DPI-C exports you need to specify as additional argument the generated dvt_dpic/dvt_lib_export.so.